2. Main interface elements#
The following sections introduce the features of NAVIGATOR’s three seperate interface windows.
|
|
|
2.1. Main user interface (Operator display)#
2.1.1. Graphical and textual elements#
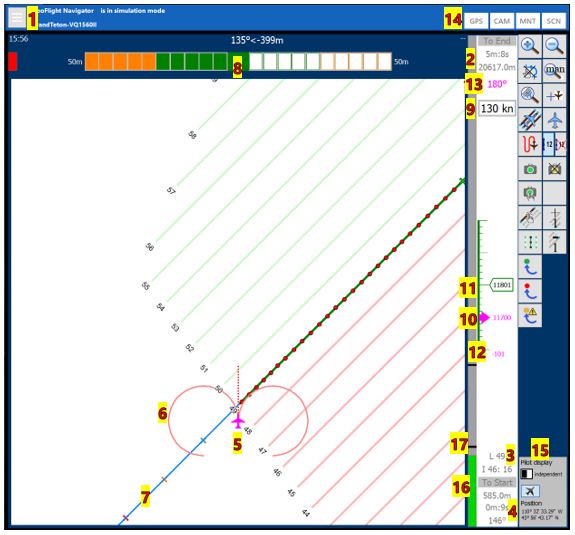
1 |
Click the bar symbol to open the settings menu. |
2 |
The line deviation indicator displays the current deviation between the aircraft and the flight line. In this case, 50m is the tolerance bandwidth on each side of the line. Images will be taken only within the tolerated bandwidth. |
3 |
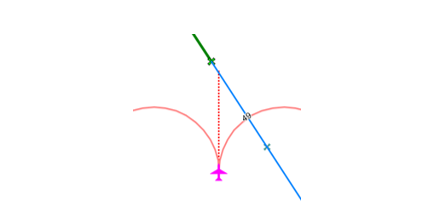
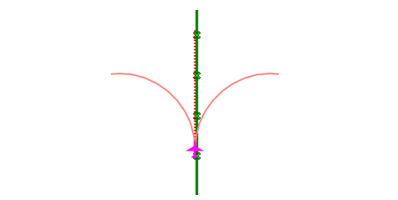
Airplane symbol with direction of flight and circles showing the standard turn Hint All values related to the aircraft (e.g. speed, altitude, azimuth and the map icon) use the same color. It can be adjusted in the map graphics. |
4 |
Three indicators mark the remaining time to the start of the line. The corresponding distances depend on the current speed.
|
5 |
The standard turn helps the pilot to smoothly turn onto the line. The radius of the circles is calculated from the current speed and the given time for turning 360° (usually 120 seconds for 360°) |
6 |
By default, the pilot display and the operator display work independently of each other. By using the switch the pilot can see the same map content as the operator. |
7 |
Map scale |
8 |
The device status bar gives a rough overview of the status of the main devices. Brief color description:
|
9 |
Time and distance until reaching the end of the flight line |
10 |
Planned azimuth of the flight line in degrees |
11 |
Actual speed |
12 |
Actual altitude |
13 |
Planned altitude |
14 |
Altitude deviation between the planned flight line and the aircraft’s current altitude (adjust altitude by this value to reach the target altitude) |
15 |
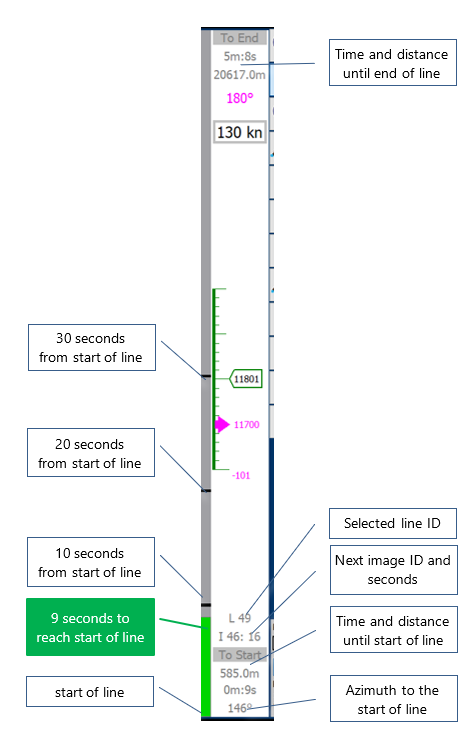
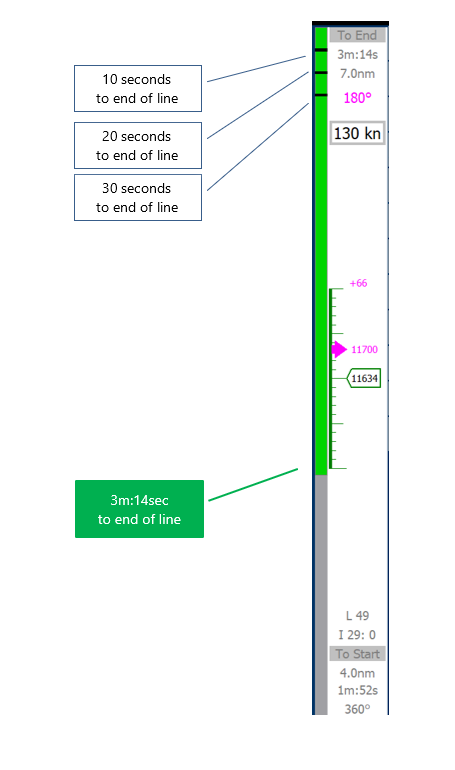
Three black ticks visualize the time (10 seconds, 20 seconds and 30 seconds) until the start of the flight line or, respectively, the end of the flight line, see vizualization of time and distance. |
16 |
The green bar visualizes how far the airplane is from the start when approaching; once on the line, it visualizes what portion of the line has already been flown, see vizualization of time and distance. |
17 |
Selected line number, next image number and time [s] until reaching the next image |
18 |
Distance and time to the start of the flight line when approaching; once on the line, distance and time from the start of the line. |
2.1.2. Main operator display buttons#
|
|
Use these buttons on the right side of the window to select flight lines, adjust the display of the current flight line and control the images taken and not yet taken. See Chapter icon description of display control for detailed information on the use of each button. |
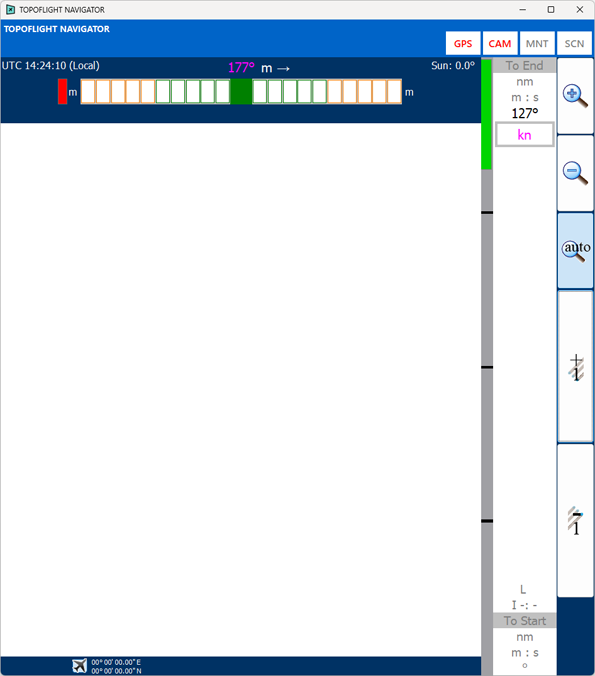
2.1.3. Bar to visualize time and distance to the end of the flight line#
The bar bordering the side of the map window represents the distance to
|
|
|
the beginning of the flight line when the aircraft approaches it. |
the end of the flight line when the aircraft is on it. |
|
|
|
|
The green bar moves from top to bottom, representing the remaining time until the aircraft reaches the start of the line. |
At the start of the line, the green bar is at the bottom. As the aircraft progresses along the line, the green bar rises, reaching the top when the aircraft arrives at the end of the line. |
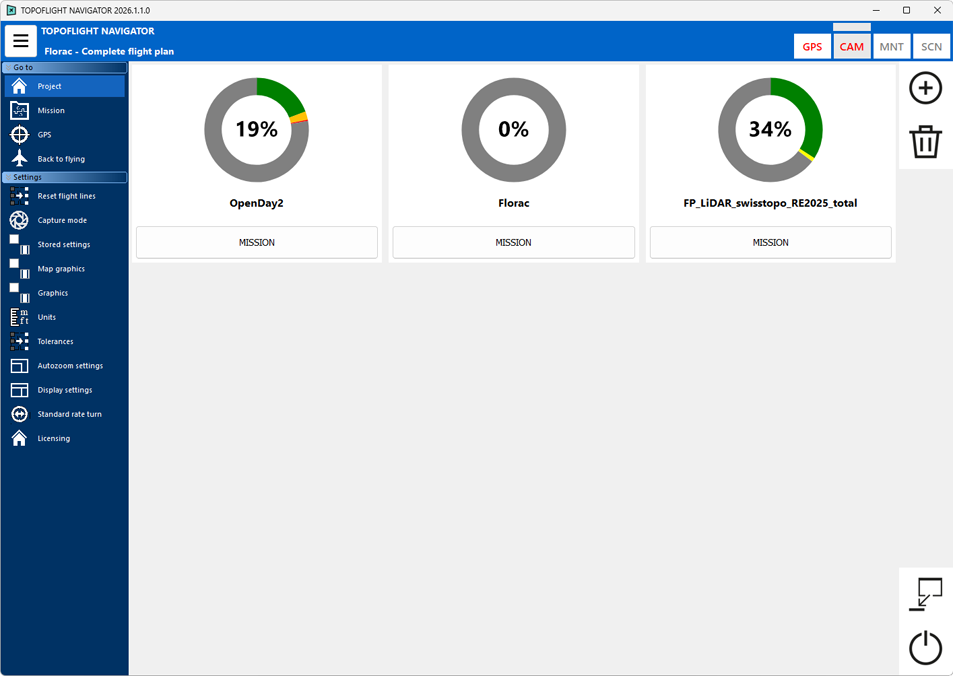
2.2. Operator / Pilot display setup#
Both TOPOFLIGHT NAVIGATOR and SensorHandler software run on the same computer while other software (like RiACQUIRE) usually runs on a separate machine. Typically, the operator display is quite large in order to view multiple software windows at once. The pilot display, on the contrary, is used for navigation only. It usually is shown on a separate monitor attached to the computer.
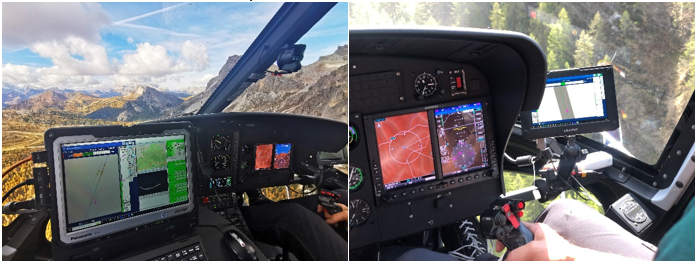
Example of an integration of TOPOFLIGHT software in a helicopter: On the left side is the operator’s screen with NAVIGATOR and RiACQUIRE applications, on the right side is the pilot’s display. Courtesy of Alto-Drones, Südtirol, Italy (www.alto-drones.com)#
2.2.1. Display settings in Windows operating system#
The NAVIGATOR program shows the operator display and the pilot display in two separate windows. The operator window of the application is on the operator’s monitor while the pilot’s window is moved to the pilot’s monitor.
Important
To support this setup, the Windows operating system must be set to extend the desktop.
A detailed description of how to set up the operator and pilot display is provided here.
2.3. SensorHandler#
2.3.1. Bridge between NAVIGATOR and sensors#
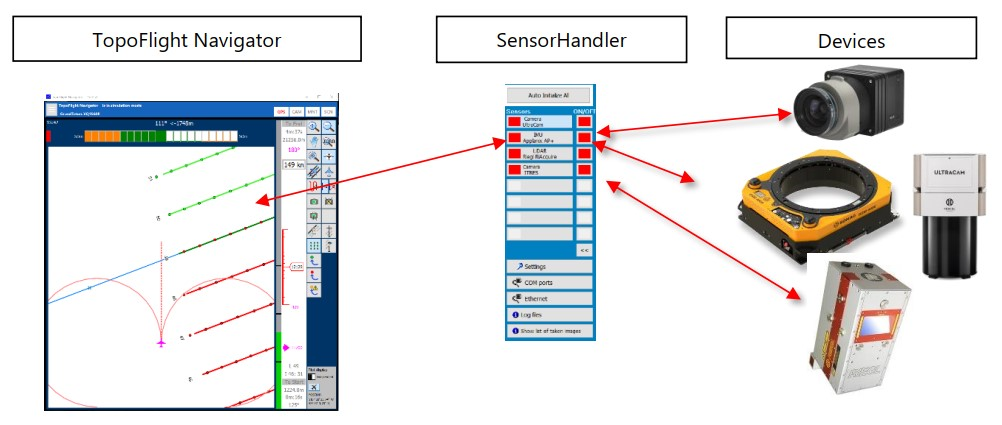
Devices such as GPS, cameras, scanners, etc. need to exchange information with the navigation software. This communication is carried out by the software called “SensorHandler”. SensorHandler is thus the link between TOPOFLIGHT NAVIGATOR and the system components. It acts as a bridge for communication between hardware and navigation software.
Hint
TOPOFLIGHT NAVIGATOR and SensorHandler are separately running applications. They can be started and stopped independently of each other. This means that SensorHandler can be closed and reopened while NAVIGATOR is running and vice versa.
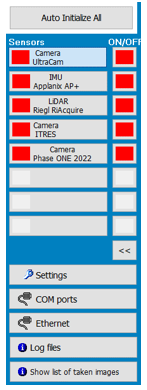
2.3.2. SensorHandler main user interface#
|
|
The image on the left shows a typical setting for attached sensors. Each button in SensorHandler can be connected to a device. The small buttons on the right of the sensors are used to switch the sensors ON and OFF. A unit is ready as soon as the button’s color has changed from red to green. Important The list of sensors works like a checklist: when all entries are green the system is ready for take-off. More information can be found in the chapter System integration |
|
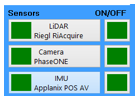
The graphic on the left shows a system containing a Riegl Scanner controlled by RiACQUIRE, one or more Phase One camera(s) and an APPLANIX INSS system. The green buttons show that the sensors are all running and communicating with SensorHandler. We are ready to fly. |