6. Quality control#
Add layers with color-coded maps to perform quality control checks of planned flight lines.
Hint
For post-flight quality control checks got to the ![]() Missions main page.
Missions main page.
6.1. Critical reasons for QC checks#
MISSIONPLANNER enables you to perform several quality control (QC) checks to assist you in evaluating if your flight plan meets the project requirements. These checks appear as an overlay over the map in the layers panel.
QC maps are georeferenced TIFF files stored in the project folder and serve the following functions:
During the planning - if you are planning a flight over difficult terrain with highly restricted project requirements (such as small tolerances for minimal and maximal GSD, or low tolerance for point density variation), you can create a QC-map over a portion of the area to check whether you fulfill the project criteria or if you must add additional lines locally. This is particularly important when planning LiDAR surveys for high point densities in challenging terrain, where the laser beam footprint must remain within the maximum allowable limits.
Final proof of the flight plan - QC maps are frequently used as an important part in a project proposal or quote to show the customer that the flight plan fulfills all project requirements.
Hint
QC maps give a far better understanding of the flight plan quality than statistical values. For example, the flight line statistics show that the GSD exceeds the maximal allowable GSD. But the QC maps shows that the portion of the flight line where the GSD is too high is where the line crosses a valley and adding another flight line along the valley will compensate for the high GSD. For this reason, it is recommended to present QC maps instead of statistics on single flight lines.
6.2. Types of QC maps#
Quality control maps can be generated for:

|
HAGL (Height above ground level) - Used especially in mountainous areas for low height flights to check if flight lines are not too close to mountain ridges or if the airplane has enough space in deep valleys to turn into the next line. |

|
Sidelap - A sidelap area is the lateral overlap of terrain by two or more flight lines. From the dropdown menu Units under the box in the secondary sidebar, select Forward overlap for the resulting map to contain the best ratio of two adjacent image footprints on the same flight line. |

|
Nr. of overlaps - number of lateral overlaps From the dropdown menu Units under the box in the secondary sidebar, select whether to compute the number images or lines. |

|
GSD (Ground sample distance) - shows the GSD in different colors for each location |

|
Radial object displacement - The wider the lens angle, the greater the resulting image displacement (building lean) in an image. A camera with a wide-angle lens needs much more lateral overlap between flight lines than a camera with a narrow FOV. Therefore, modern project requirements do not define a minimal lateral and longitudinal overlap anymore. Instead, the requirements specify a maximal building lean value (for example, a maximal allowable building lean of 20% means that a building of 10m height shall not cover more than 2m of the underlying terrain). The image displacement QC map shows if the overlap is correctly set to remain under the given maximal value. |
Additional options are available for LiDAR missions (they are automatically disabled when no LiDAR sensor is selected):
|
|
Eye safety (laser) - MISSIONPLANNER will generate a control map to identify potential hazards for the human eye. This map highlights areas where the laser range falls below the NOHD (Nominal ocular hazard distance) and ENOHD (Extended nominal hazard distance; with viewing aids such as binoculars) distances. |
|
|
Point density - number of resulting points on the surface If the area is covered by more than one flight line, the resulting map displays the cumulative sum of points collected from all flight lines covering the area. The map will show no result when the terrain is out of laser range. |
|
|
Laser range - distance from the ground to the origin point of the laser beam on the flight line Important The default class indicated by the red color does not necessarily signify that the maximum laser range (according to the max. range value in the sensor configuration) has been exceeded. It simply corresponds to the basic classification from red to green. |
|
|
MTA zones (Multiple time around zones) - High measurement rates combined with long ranges result in laser range ambiguities. This function displays the different MTA zones geographically. |
|
|
Laser beam footprint - diameter of the laser beam on the ground |
6.3. Creating QC maps#
For each QC check, you can define how the check results are displayed in the Map Panel, such as color thresholds, units of value legend placement and grid resolution.
6.4. Adjusting the grid#
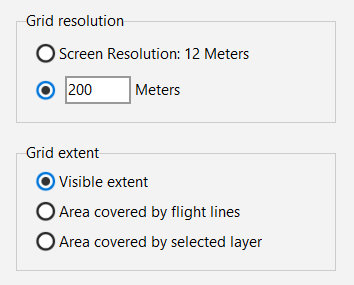
Resolution
The resolution of the QC map can be adjusted in the secondary sidebar.
Hint
For the first impression, a resolution of 200m is recommended. A higher resolution requires more computing time.
The screen resolution depends on the current zoom level in the workspace.
Extent
Select one of the following options to choose the grid extent that corresponds to your specific needs:
the visible extent
the area covered by flight lines
the area covered by layer selected in the layers panel
6.5. Displaying individual raster element values#
In the status bar, you can now change the default selection from Terrain to a different value, like GSD, if a GSD map has been generated. The Cell value will then reflect the GSD value of the raster element that the mouse is hovering over.
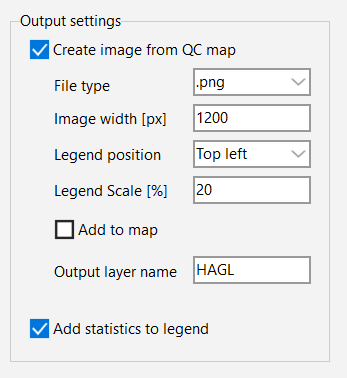
6.6. Creating an image file#
The QC maps drawn in TOPOFLIGHT MISSIONPLANNER are raster maps, not images. Navigate to the Output settings section in the secondary sidebar of the QC page and configure the export settings to meet your requirements.
Hint
You can also opt to right-click on the quality control map layer in the layers panel and select Save Layer as Image to open a dialog with the corresponding user interface.
Displaying the map
To display the image in your workspace, click on the Add to map box. A new layer with the ending _export will be added in the layers panel.
Saving the file
The georeferenced image is automatically saved in the project folder. Please note that the data for the image file has been rendered and is not in the raw, original MISSIONPLANNER layer format.
Adding statistics
You can enhance your legend by adding statistics regarding the percentage of area within each value range. Simply click on the Add statistics to legend box in the output settings section of the secondary sidebar.