Projects requiring multiple missions involve e.g. projects with staggered schedules, organizational separations or supplementary flights. Each mission contains a set of entire and/or partial flight lines. The size of a mission depends on different factors, such as the number of possible flight hours, weather conditions and separation between areas with and without snow and foliage conditions.
At the end of a flight day, the flight crew can send their information on collected images and lines to the office. The individual missions make it easy to obtain the current status of the project’s progress. Based on this information, additional missions can be defined or existing missions can be adjusted and forwarded to the flight crew.
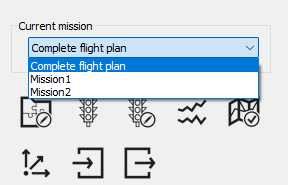
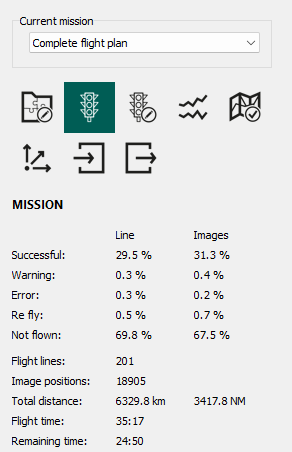
At the top of the secondary sidebar, select the mission you would like to work on.
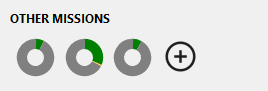
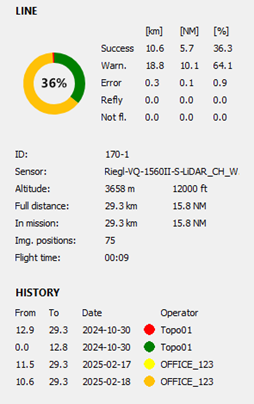
You can also switch between missions by clicking the corresponding sunburst chart under OTHER MISSIONS which is colored according to the flight line and image status.
When you hover the mouse over a chart, a tooltip will appear displaying the respective mission name.
Hint
If no individual missions have been created, the Complete flight plan is automatically selected. This default flight plan is created automatically and is available for every project. It includes all flight lines. While you can modify its properties (such as transfer speed and turn time), you cannot delete or add lines. To make such changes, copy the flight plan and save it under a new name.
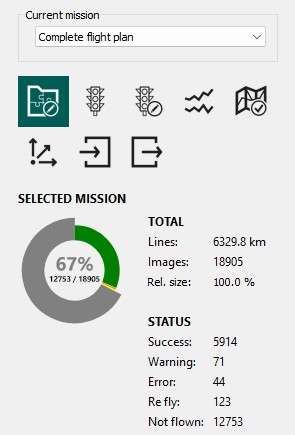
Easily switch between missions or show the details of the entire project by selecting the respective Current mission.
Image and flight line history
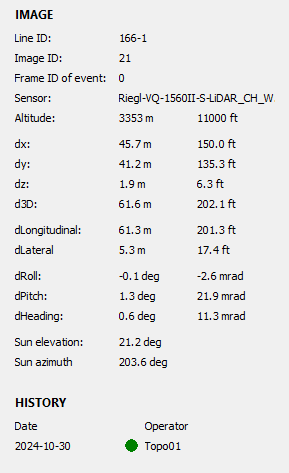
For IMAGES, the history includes the date the image was taken, the status and the operator name.
For LINES, the history lists the starting point (From) and endpoint (To), the date, the status and the operator name.
Even if the line was flown only once, the history may contain multiple rows of entries, as each status change generates a new row. An error message in the middle of a line would thus generate three rows in the history with the statuses green-red-green.
You can manually update the status of images and flight lines.
Common reasons for doing so include blurry or missing images, cloud cover, or failure to meet project specifications.
In such cases, the status initially assigned by NAVIGATOR can later be adjusted by the operator during post-processing. For images marked as successful, NAVIGATOR will not trigger the camera to capture a new image if the flight line is reflown. When a flight line is selected in NAVIGATOR, it is automatically cropped to only include sections that are not yet marked as successful.
Important
All manual status updates are stored in the cache and are only permanently saved in new .csv files in the _IMAGES and _LINES folders when the user clicks .
Create postflight quality control maps to assess how well the flown flight lines meet the project requirements. The postflight calculations are based on the actual GNSS and IMU data. However, the calculated footprints determined through aerotriangulation and trajectory analysis may still vary.
Postflight QC also helps you determine which lines might have to be reflown. You can then easily update the flight line status accordingly.
Hint
Postflight QC maps are created in the same manner and share the same properties as preflight quality control maps.
The actual location of an image often differs slightly from its planned position. To better understand the magnitude and direction of this deviation, you can display both the positional deviation (horizontal deviation, 2D) and the height deviation (altitude deviation, 1D). Keep in mind that the postflight position is calculated based on the actual GNSS and IMU data, which imposes certain limitations on its precision. However, this data is more than sufficient for an initial assessment of flight line and image quality.
After a mission or parts of a mission have been flown, the respective .TFX file(s) can be imported. They contain all information on the images, lines and missions.
Upon import, new files are added to the existing _IMAGE, _LINE and _MISSION folders. This updates all flight line and image information while preserving the history.
Important
Never manually modify the .csv files in the _IMAGE and _LINE folders! Doing so will corrupt the history.
Hint
Find detailed information on .tfx file naming and content here.
Any changes made to the active project are saved either by clicking in the workspace or by exporting the project, as outlined below.
As soon as the export options are accessed for a project for the first time, a new folder _EXPORT is created in the project folder.
All exported missions are saved in that folder as a .TFX file.
You can also choose to export only the footprints. Footprints are essential for post-processing analysis, as actual footprints often differ from the planned ones. Use them to identify gaps, assess flight path quality, or detect potential camera issues.
In the export options, you can choose between exporting the footprint of the entire flight line or the overlapping footprints of the individual images.
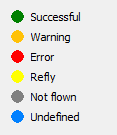
Click for flight line and image status display options. Use these features to simplify mission analysis as well as mission editing or creation by showing or hiding specific flight lines and images based on their status.
The status Undefined is uncommon and typically should not occur under normal conditions.
Hint
Got to Settings to adjust the flight line and image status display properties, such as the line width and color.
Check the box Show image labels and select the property (Image ID or capture FrameID/Time/Code) you would like to have displayed.
For flight lines flown multiple times, select Latest to display the most recent data or Best to show the highest-quality data. When using Best, results from different missions may be combined to display the overall best data available for each line/image.